Throughput vs Bandwidth: Understanding Real Network Performance
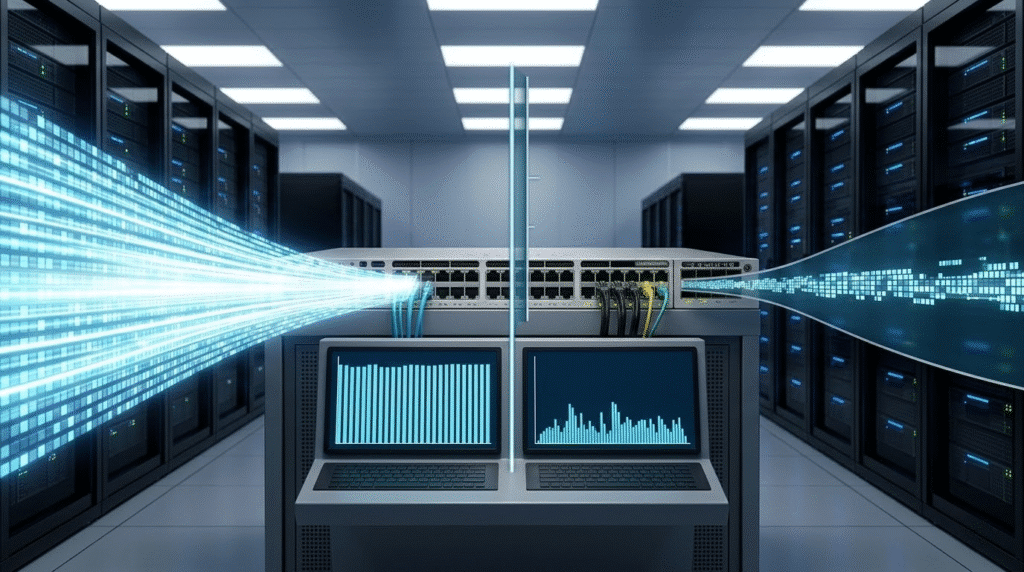
Throughput and bandwidth are often confused in networking. Bandwidth represents the maximum theoretical capacity of a network link, while throughput measures the actual amount of data successfully transmitted over time. In enterprise networks, device performance is also heavily influenced by forwarding rate, which dictates how many packets a switch or router can process per second.
Executive Summary
Many network engineers assume that upgrading to a higher bandwidth automatically guarantees better network performance, but real-world deployments often prove otherwise. Bandwidth simply defines the theoretical capacity of a physical or logical link. Throughput, however, represents the actual, successful data transfer achieved under active network conditions—and it is functionally always lower than bandwidth. In enterprise environments, hardware limitations such as forwarding rate and switching capacity dictate how well a device handles traffic. Understanding how these distinct metrics interact is critical for IT teams to evaluate switches, diagnose complex bottlenecks, and design scalable, high-performance campus network architectures.
What Is Bandwidth in Networking?
Bandwidth Definition
In networking, bandwidth is the maximum data capacity of a specific physical or logical link. It defines the maximum amount of data that can theoretically be transmitted from a source to a destination in a given amount of time. If a network is a highway, bandwidth is the number of lanes available for cars to travel on.
How Bandwidth Is Expressed
Bandwidth is universally expressed in bits per second. Common units include:
- bps: bits per second
- Mbps: Megabits per second
- Gbps: Gigabits per second
- Tbps: Terabits per second
Bandwidth Examples in Enterprise Networks
It is crucial to remember that bandwidth represents a theoretical ceiling, not a guaranteed transfer speed.
| Network Link | Bandwidth |
| 1G Access Port | 1 Gbps |
| 10G Switch Uplink | 10 Gbps |
| 100G Core Backbone | 100 Gbps |
How Is the Bandwidth of a Network Measured?
Network engineers use several methods and tools to measure and verify network bandwidth, depending on whether they are checking hardware capabilities or active utilization.
Interface Speed
The simplest way to verify the negotiated bandwidth of a link is by checking the interface speed directly on the network device. For example, using the show interface command on a Cisco switch will display the hardware-negotiated bandwidth limit (e.g., full-duplex, 1000Mb/s).
Network Monitoring Tools
Enterprise environments rely on passive monitoring protocols to track bandwidth utilization over time without interrupting traffic:
- SNMP (Simple Network Management Protocol): Polls interface statistics at regular intervals to map overall link usage.
- NetFlow / sFlow: Analyzes traffic flow data to see exactly which applications or IP addresses are consuming the bandwidth.
- Streaming Telemetry: Pushes real-time, granular interface data directly to a centralized collector.
Network Testing Tools
To actively measure how much bandwidth is available end-to-end, engineers use load-testing tools:
- iPerf / iPerf3: Industry-standard command-line tools for measuring maximum TCP and UDP bandwidth performance between two nodes.
- Traffic Generators: Specialized hardware or software used to flood a link with frames to test its absolute capacity.
What Is Throughput in Networking?
Throughput Definition
Throughput is the actual delivered data rate. It measures the amount of data that successfully arrives at its destination within a specific timeframe, reflecting the real, observable performance of the network. Returning to the highway analogy, throughput is the actual number of cars that make it through a toll booth in an hour.
Why Throughput Is Lower Than Bandwidth
You will never achieve a throughput that perfectly matches your theoretical bandwidth. Throughput is constantly reduced by:
- Protocol Overhead: TCP/IP headers, Ethernet frames, and encryption overhead (like IPsec headers and padding) take up physical space on the wire but are not part of the actual useful application data being transferred.
- Packet Retransmission: Packets dropped due to errors must be resent, wasting valuable link capacity.
- Network Congestion: High traffic volumes cause queuing delays at router interfaces.
- Network Latency: The physical distance between endpoints slows down the rate of TCP acknowledgments.
- Hardware Processing: Firewalls, load balancers, and routers require CPU cycles to inspect, translate (NAT), and route traffic.
Throughput Example
Seeing lower throughput on a high-bandwidth link is normal behavior. For instance, a 10G link will rarely deliver exactly 10 Gbps of file transfer speed.
| Metric | Value |
| Link Bandwidth | 10 Gbps |
| Actual Throughput | 7.2 Gbps |
Throughput vs Bandwidth
The core difference between these two metrics comes down to potential versus reality.
| Metric | Bandwidth | Throughput |
| Meaning | Maximum link capacity | Actual successfully delivered data |
| Unit | Mbps / Gbps | Mbps / Gbps |
| Affected By | Interface speed, physical media | Congestion, latency, protocol overhead |
| Real-World Example | A 10 Gbps fiber link | 7.5 Gbps of real file transfer traffic |
What Is Forwarding Rate?
Forwarding rate describes how many individual packets a network device can process and forward per second.
Instead of measuring the volume of data in bits, it measures the raw processing capability of the switch’s internal hardware, specifically its ASIC (Application-Specific Integrated Circuit). Forwarding rate is expressed in:
- pps: packets per second
- Mpps: Millions of packets per second
Bandwidth vs Throughput vs Forwarding Rate
When evaluating network hardware or diagnosing performance, you must look at all three metrics to understand the full picture.
| Metric | What It Measures | Unit | Example |
| Bandwidth | Maximum link capacity | Mbps / Gbps | 10G Ethernet |
| Throughput | Actual traffic delivered | Mbps / Gbps | 7.5 Gbps |
| Forwarding Rate | Hardware packet processing capability | Mpps | 720 Mpps |
Switching Capacity vs Forwarding Rate
When evaluating enterprise switches, engineers often see two additional specifications in datasheets: switching capacity and forwarding rate. While they are related, they measure different aspects of a switch’s performance.
Switching capacity represents the total internal bandwidth a switch can handle across all ports. It is typically measured in Gbps or Tbps and reflects the maximum amount of data the switching fabric can move between interfaces simultaneously.
Forwarding rate, on the other hand, measures how many packets the device can process per second. It is usually expressed in packets per second (pps) or millions of packets per second (Mpps) and reflects the packet-processing capability of the switch’s ASIC.
| Metric | What It Measures | Unit |
|---|---|---|
| Switching Capacity | Total internal data bandwidth of the switch fabric | Gbps / Tbps |
| Forwarding Rate | Maximum packet processing capability | pps / Mpps |
These metrics become especially important when evaluating enterprise hardware. A switch may have very high switching capacity, but if the forwarding rate limit is reached due to large volumes of small packets, the device can still become a performance bottleneck. This is why network engineers analyze switching capacity, forwarding rate, bandwidth, and throughput together when selecting switches for high-traffic environments.
Why Switch Datasheets List Forwarding Rate Instead of Throughput
If you look at an enterprise Cisco, Juniper, or Arista datasheet, you will rarely see a “throughput” specification. Instead, vendors list switching capacity and forwarding rate.
Throughput is highly subjective. It depends heavily on your specific environment: your traffic patterns, packet sizes, and the protocols in use. Vendors cannot guarantee a specific throughput because they do not control your network conditions.
Forwarding rate, however, is an absolute hardware limitation defined by the switch’s silicon architecture. It tells the network engineer exactly what the hardware is capable of handling under strict, standardized testing conditions.
Real Example: How These Metrics Apply to a Cisco Switch
Let’s look at how these metrics apply to a real-world enterprise device: the Cisco Catalyst 9300-48P.
| Metric | Value |
| Switching Capacity | 256 Gbps |
| Forwarding Rate | 190.47 Mpps |
| Uplink Bandwidth | 40G (via 4 x 10G network module) |
Engineering Note: The 256 Gbps switching capacity is bidirectional. It is perfectly calculated by adding the 48 downlink Gigabit ports and the maximum 80 Gigabit uplink capacity (128 Gbps total capacity), then multiplying by 2 for full-duplex. Even with this robust hardware, the actual throughput a user experiences behind this standalone switch will still be dictated by network congestion, TCP overhead, and the absolute 190.47 Mpps hardware packet-processing ceiling.
Why You Aren’t Getting Full Bandwidth: The Hidden Factors
When a 10G link only pushes a few Gigabits of throughput, enterprise engineers look beyond the basics to diagnose the root cause. Here are the advanced factors that dictate real network performance.
1. The Impact of Packet Size on Forwarding Rate
Switch performance is heavily influenced by the size of the data packets. Forwarding rate limits are typically stress-tested using the smallest possible Ethernet frame (64-byte). Processing millions of tiny packets requires the switch to read millions of headers, rapidly exhausting ASIC resources.
Conversely, transmitting maximum-size frames (1518-byte) requires significantly less processing overhead per gigabit of data. This is why achieving “wire speed” bandwidth is much easier with large packet sizes (like storage transfers) than with tiny packet sizes (like voice traffic or gaming).
2. TCP Window Size and Bandwidth-Delay Product (BDP)
On Wide Area Networks (WAN) or inter-data-center links, latency destroys throughput, regardless of how much bandwidth you purchase. This is governed by the Bandwidth-Delay Product (BDP), which calculates the maximum amount of unacknowledged data that can be in transit on a network at one time:

If the TCP receive window size of the communicating machines is smaller than the network’s BDP, the sender will pause and wait for acknowledgments before sending more data. This leaves the physical bandwidth heavily underutilized, explaining why a 10 Gbps trans-Atlantic link might only yield 2 Gbps of throughput.
3. Throughput vs Goodput
While throughput measures the total bits successfully delivered, Goodput measures only the useful application-layer payload. Throughput includes all the TCP, IP, and Ethernet header overhead. Goodput is what the end-user or application actually experiences. If you have high protocol overhead—such as deep IPsec encryption tunnels or double-tagging (QinQ)—you can have high network throughput but disappointingly low goodput.
Common Misconceptions About Bandwidth and Throughput
- “Bandwidth equals speed.”
❌ Incorrect. Bandwidth is capacity, not speed. High bandwidth only feels like “high speed” when you are downloading large files that can utilize the wider pipe. - “Higher bandwidth guarantees a faster network.”
❌ Incorrect. If your latency is high, or your switch’s forwarding rate is maxed out by tiny packets, upgrading from a 1G to a 10G link will not make the network faster. - “Throughput should always equal bandwidth.”
❌ Incorrect. Due to protocol overhead, hardware limits, and network conditions, throughput is functionally always lower than bandwidth.
How Network Engineers Diagnose Throughput Bottlenecks
When throughput drops significantly below expected bandwidth, engineers investigate the following critical areas:
- Interface Congestion: Checking for output drops or microbursts on switch port buffers.
- Device CPU Usage: Ensuring the router or switch control plane is not overwhelmed by routing table calculations or management traffic.
- Physical Packet Drops: Using tools to identify physical layer issues (like degraded fiber optics or bad copper cables) causing CRC errors.
- Buffer Queues: Analyzing if the switch’s memory buffers are inadequate for the specific bursty traffic patterns in the network.
- Routing Performance: Checking if complex Access Control Lists (ACLs), deep packet inspection (DPI), or NAT translations are bottlenecking the hardware’s forwarding rate.
FAQ
What is the difference between bandwidth and throughput?
Bandwidth is the theoretical maximum capacity of a network link, while throughput is the actual amount of data successfully transmitted under real-world conditions.
Why is throughput always lower than bandwidth?
Throughput is reduced by protocol overhead (like TCP/IP headers), network latency, packet loss, and the processing time required by routers and firewalls.
How is the bandwidth of a network measured?
It is typically verified via interface configuration limits, monitored passively using tools like SNMP or NetFlow, and actively tested using load-testing utilities like iPerf3.
What limits throughput in a network?
End-to-end latency, physical link congestion, hardware forwarding rate limits, and inadequate TCP window sizing (BDP) all restrict actual throughput.
What is forwarding rate on a switch?
Forwarding rate is the hardware-defined limit of how many data packets a switch’s ASIC can process and route per second, usually measured in Millions of packets per second (Mpps).
Conclusion
Distinguishing between these core metrics is fundamental to enterprise networking. Bandwidth defines the theoretical capacity of your cables and interfaces. Throughput shows the real performance your applications experience. Forwarding rate reflects the raw hardware capability of your networking equipment.
Understanding these differences ensures that when you design high-performance network architectures, you are selecting the right switches and routers to meet your actual traffic demands and application needs, rather than just buying the biggest port speeds and hoping for the best.